Choosing a Lindt chococlate bar.
I built a small dataset to help decide which Lindt chocolate bar was the best. Clearly lower cacao percentage tastes better, but what are the nutritional tradeoffs?
Here is the dataset I assembled. Feel free to use it:
percent,calories,fat,carbs,protein,serving,url
90,180,16,9,3,30,https://www.lindt.ca/en/lindt-excellence-90-cacao-dark-chocolate-bar-100g
31,160,9,17,2,30,https://www.lindt.ca/en/lindt-swiss-classic-gold-milk-chocolate-bar-300g
49,170,10,18,2,30,https://www.lindt.ca/en/lindt-swiss-classic-gold-surfin-dark-chocolate-bar-300g
47,160,10,18,2,30,https://www.lindt.ca/en/lindt-excellence-sea-salt-dark-chocolate-bar-100g
95,200,18,8,4,32,https://www.lindt.ca/en/lindt-excellence-95-cacao-dark-chocolate-bar-80g
100,310,28,14,6,50,https://www.lindt.ca/en/lindt-excellence-100-cacao-bar-50g
90,180,16,9,3,30,https://www.lindt.ca/en/lindt-excellence-90-cacao-dark-chocolate-bar-100g
99,320,26,14,8,50,https://www.lindt.ca/en/lindt-excellence-99-cacao-bar-50g
70,170,12,14,3,30,https://www.lindt.ca/en/lindt-excellence-70-cacao-dark-chocolate-bar-100g
78,170,14,11,3,30,https://www.lindt.ca/en/lindt-excellence-78-cacao-dark-chocolate-bar-100g
85,170,14,11,4,30,https://www.lindt.ca/en/lindt-excellence-85-cacao-dark-chocolate-bar-100g
You can check the exact listing in the url field but I only took the bars without extra toppings (i.e. the ones with just a percentage on the front).
Here is a look at the relationship between cocoa percentage and macronutrient content per 100g.
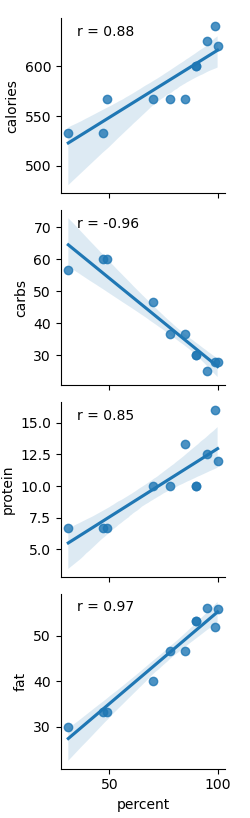
A few observations:
- Strong linear relationships between cacao content (CC) and all variables
- Strongest correlation was between CC and fat content (.97) and carb content (-.96).
- If you want to save on calories, go for light chocolates.
- The high CC are a good keto option.
Source code:
import numpy as np
from scipy import stats
import matplotlib.pyplot as plt
import seaborn as sns
import pandas as pd

def corrfunc(x, y, **kws):
    r, _ = stats.pearsonr(x, y)
    ax = plt.gca()
    ax.annotate("r = {:.2f}".format(r),
                xy=(.1, .9), xycoords=ax.transAxes)

df = pd.read_csv("chocolate.csv")
x_vars = ["calories", "carbs", "protein", "fat"]
y_vars = ["percent"]
for v in x_vars:
    df[v] /= df['serving']
    df[v] *= 100

g = sns.PairGrid(df, y_vars=x_vars, x_vars=y_vars)
g = g.map(sns.regplot)
g.map(corrfunc)
plt.show()